Logbook Stats and Insights
Last Updated:
Super Sofa Feature
Logbook Stats require a Super Sofa subscription.
Your Logbook isn’t just a record of what you’ve watched, read, and played — it’s full of insights about your habits and preferences.
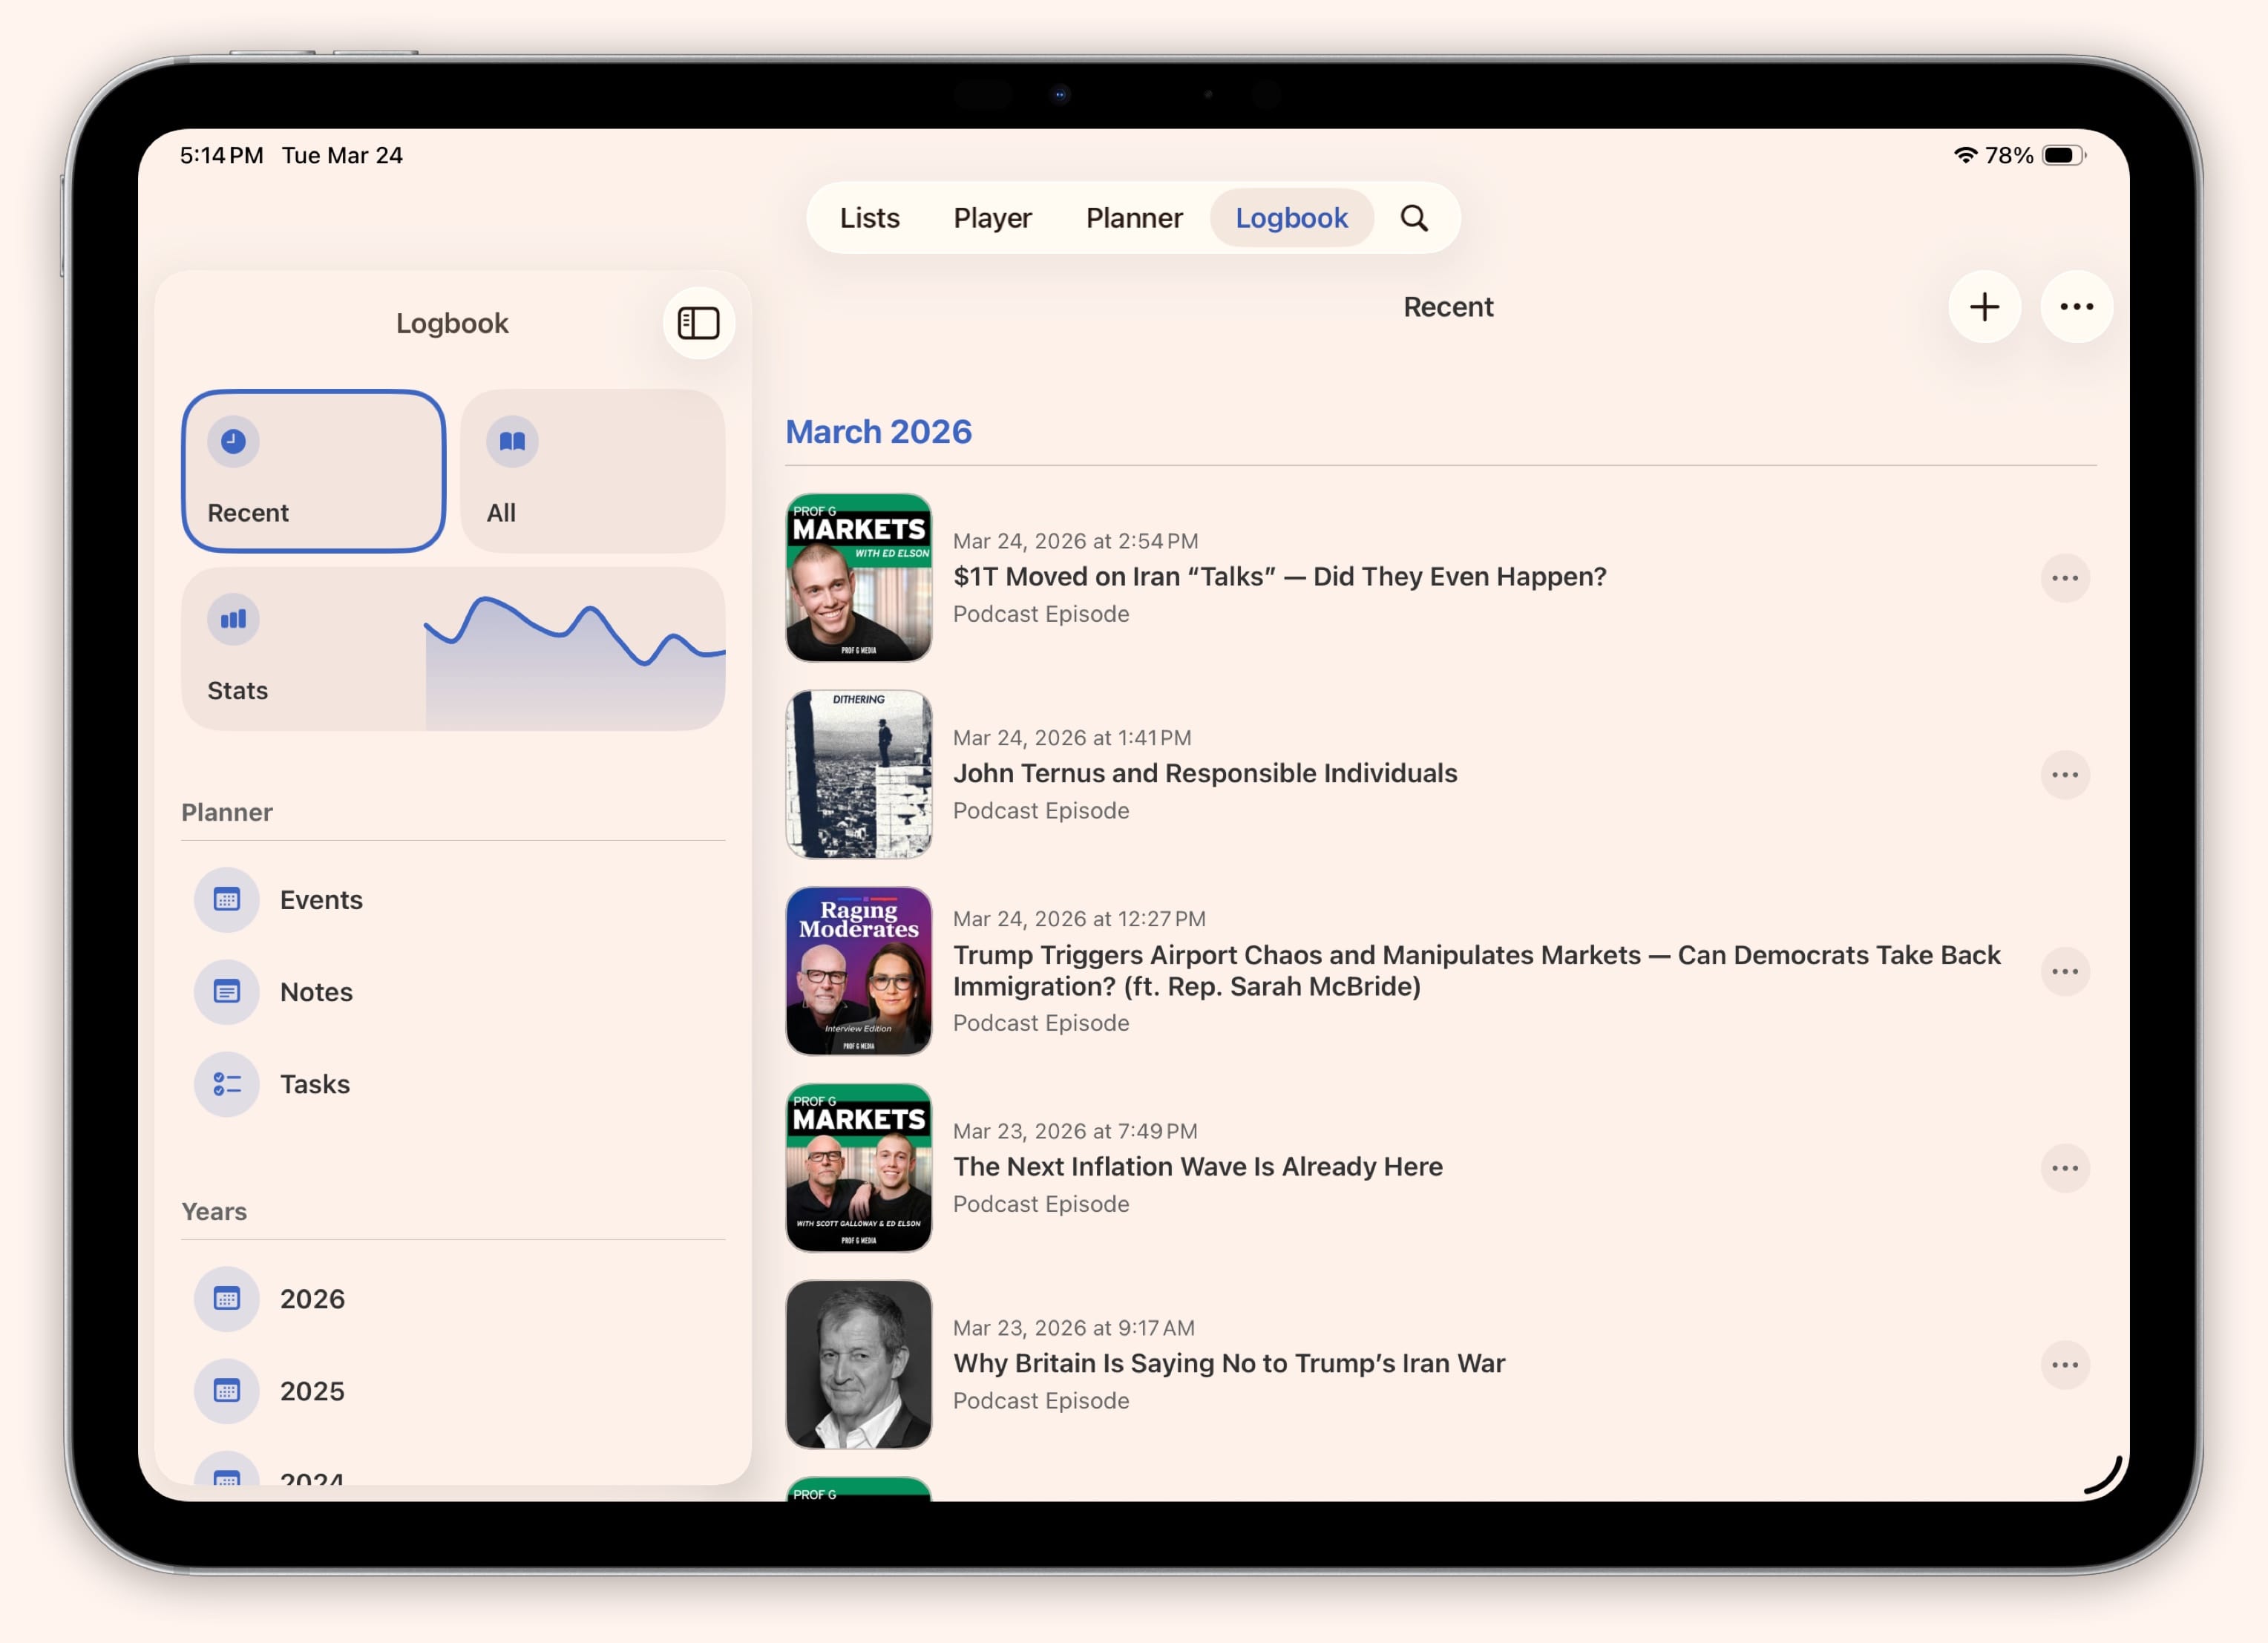
Stats Dashboard
Open the Logbook and tap the stats icon to see a high-level overview:
- Totals — How many items you’ve logged this week, month, year, and all-time
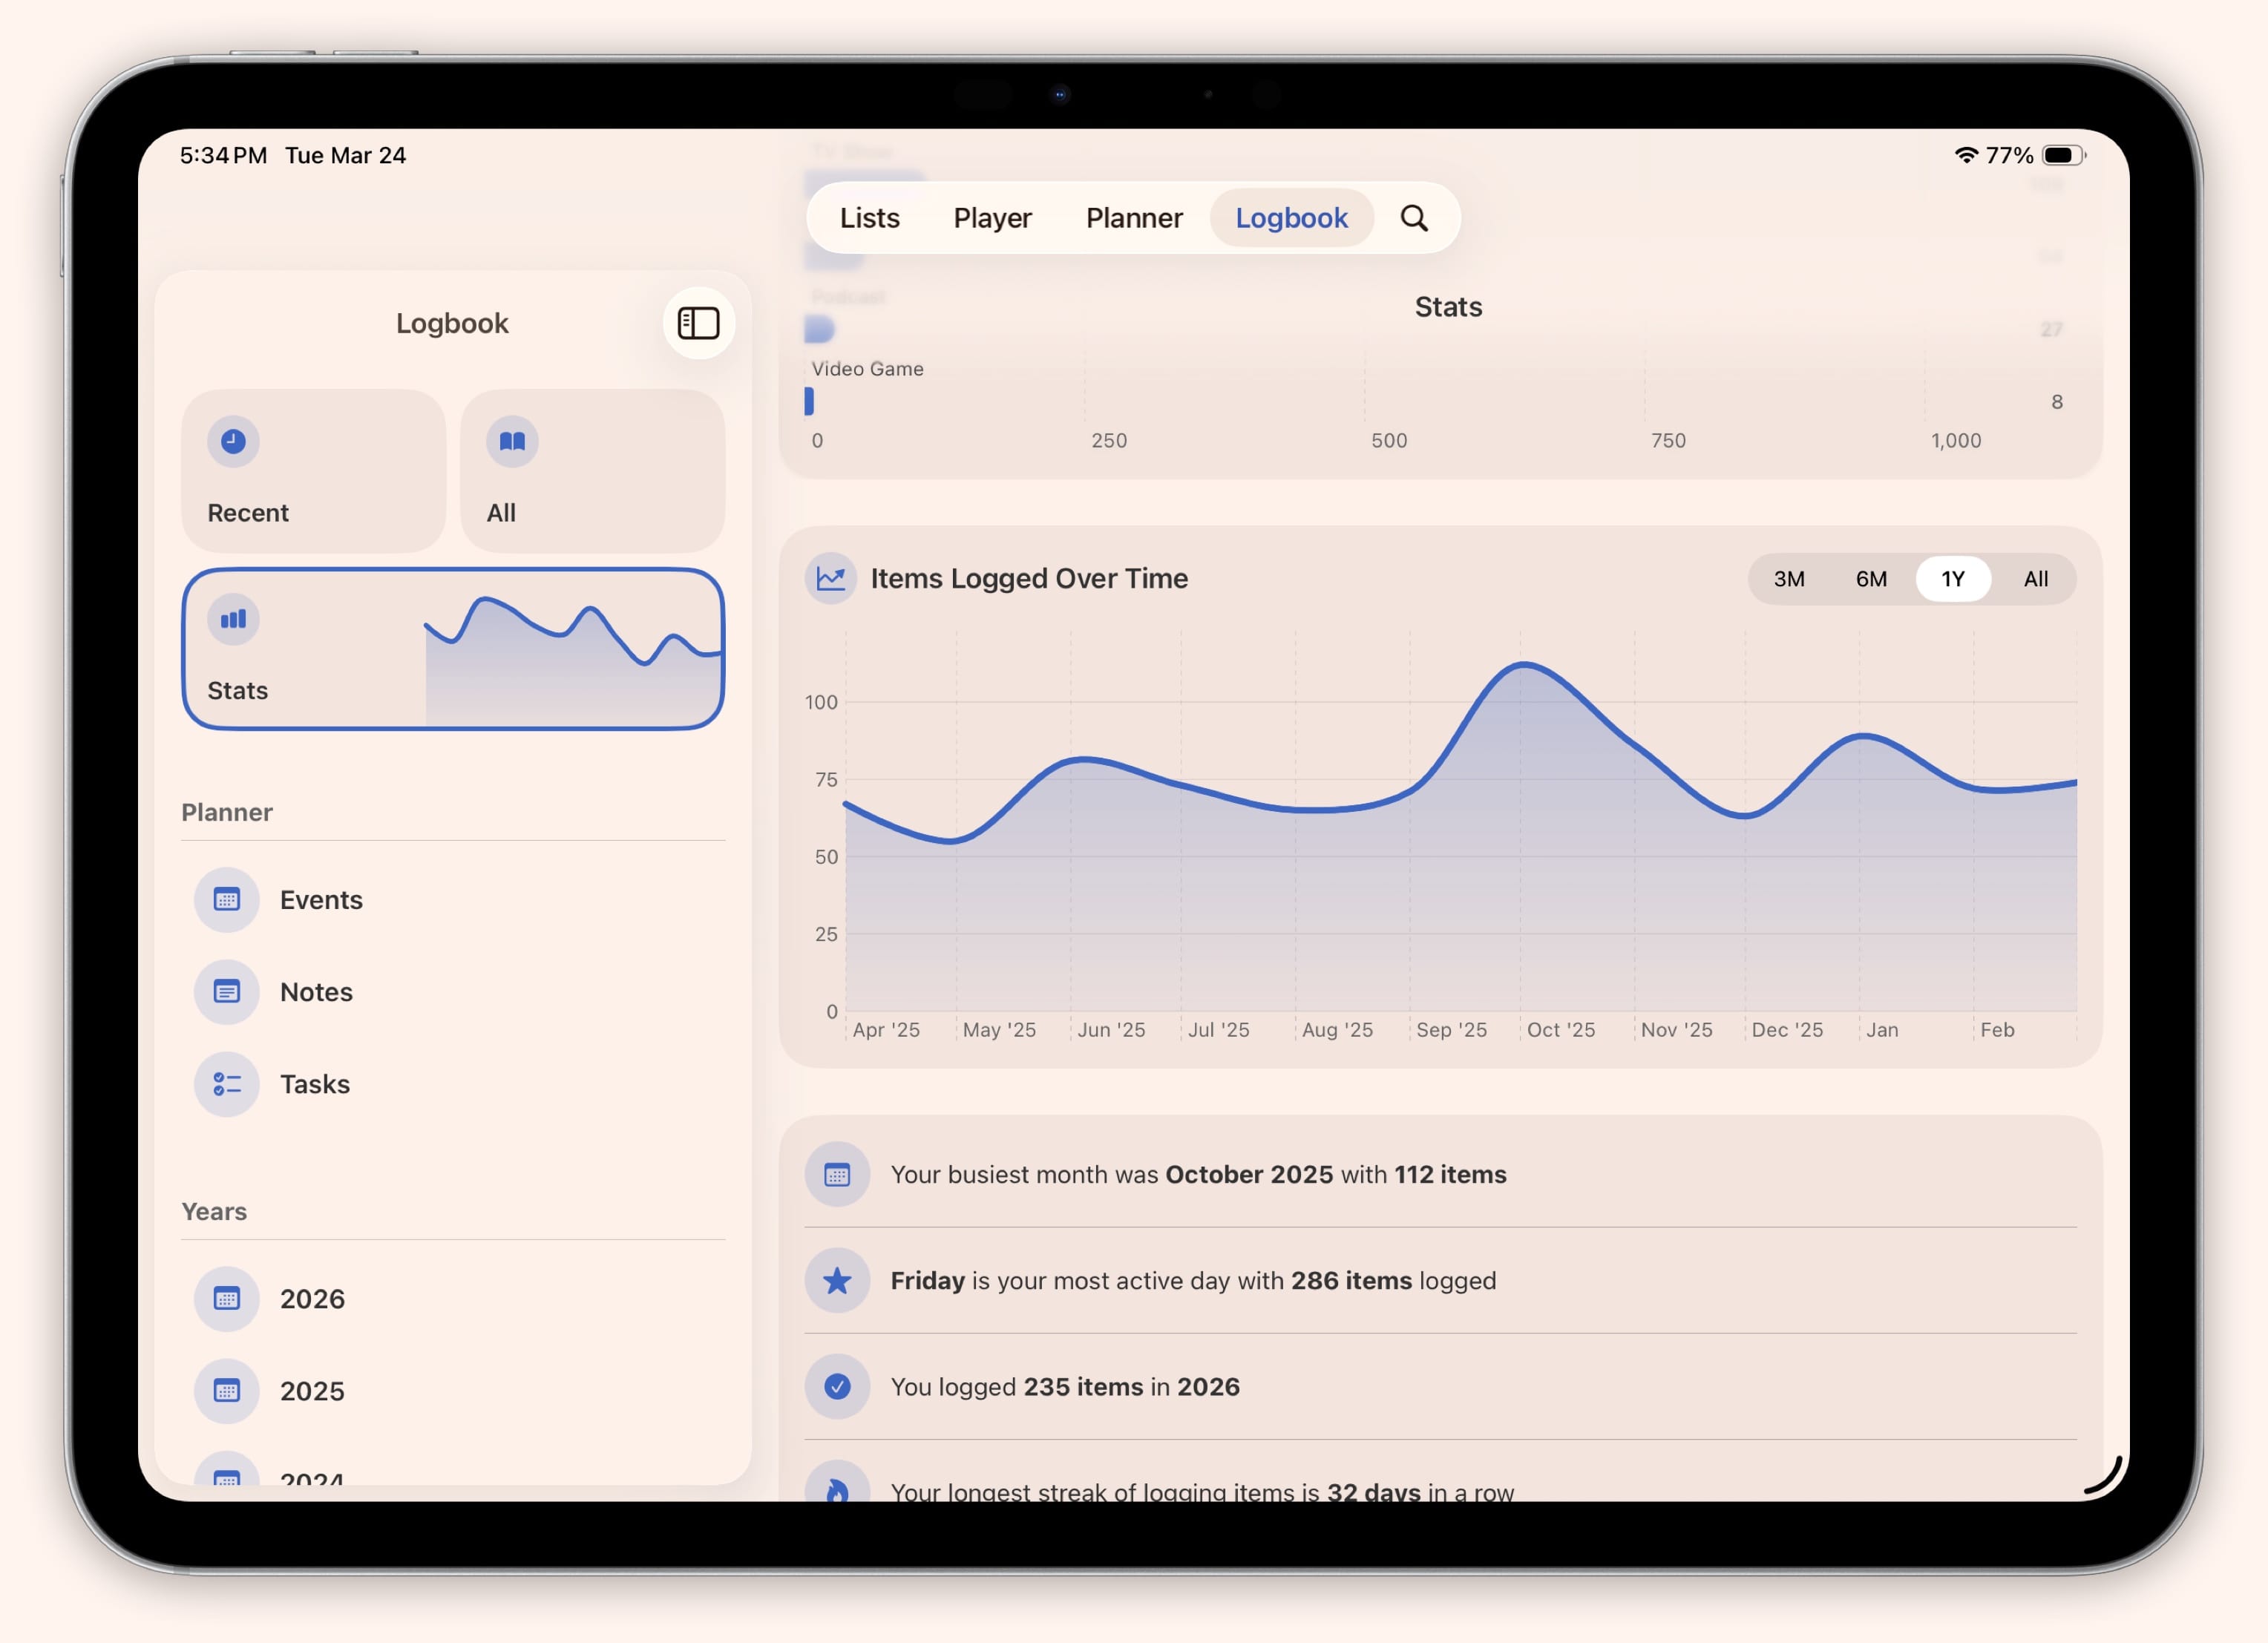
- Activity timeline — A chart showing your activity over the past 12+ months
- Category breakdown — Which media types you engage with most
Type-Specific Stats
Tap into any media type for deeper analytics:
Summary
Key metrics like episodes watched, hours listened, movies logged, and books read. See your top shows, podcasts, and books ranked by activity.
Habits
- Monthly velocity charts showing your pace over time
- Peak day-of-week patterns — which days you watch, read, or play the most
- Genre breakdowns showing your taste profile
- Decade distribution for movies
- Author and artist preferences
Fun Facts
Sofa finds patterns in your data and surfaces personalized observations:
- “You binge 4.2 episodes on Saturdays”
- “31% more books than last year”
- “Just logged your 100th podcast episode”
- Streaks and personal records
Year-Over-Year Comparisons
See how your habits have changed compared to the same period last year. Are you watching more TV? Reading fewer books? Stats make it easy to spot trends.